

 |
 |
| Home | PhotoAcute Studio | Technology |
| Technologies Overview | Superresolution FAQ | [Examples and tests] | Technology Licensing | |||||||||||||
Introduction |
||
MTF50 (MTF stands for Modulation Transfer Function, also known as SFR - Spatial Frequency Response) is the common parameter used for measuring image sharpness - the most important image quality factor. This article describes the MTF comparision of digital photographs, processed by PhotoAcute and the original photographs, taken with the same digital camera. Tests show up to x2 MTF increase, which is equivalent to x2 resolution increase. You can find more information about MTF on Imatest site. To skip the description and proceed directly to the results, click here. |
||
The procedureTo measure MTF, one of the leading image analysing tools - Imatest was used.The tests were performed with the photographs taken with Canon EOS 300D digital camera with EF-S 18-55mm f/3.5-5.6 USM lens (kit) and EF50mm f/1.8 II lens. The sample target is the gray-white vertical edge, tilted 5 degrees. The photographs were taken in series of 8 frames in each and processed by two versions of PhotoAcute Studio: version 1.0, processing 8-bit JPEG images and the Pro version (which was in development at the time of creation of this article), processing 16-bit RAW images. Sharpening Since every digital camera sharpens images to some degree, the comparision of MTF between the sharpened image and the PhotoAcute procesing result (especially RAW processing result) may have little meaning. Strong sharpening may lead to high MTF50, but poor quality. Little sharpening (note that PhotoAcute does not apply standard sharpening, allowing user to perform it in specialized applications) will have an MTF50 that doesn't indicate real image quality. To obtain a good measure of sharpness, the differences in sharpening must be removed from the analysis. Imatest tool has a special feature for removing the difference in sharpness - setting the sharpening of all images to a standard amount. This means sharpening undersharpened images and de-sharpening (blurring) oversharpened images. In this test we used both ways - measuring MTF50 without standartized sharpening and with standartized sharpening. In the final results table, the results obtained with sharpness correction are indicated in parentheses. Measurement: Canon EOS 300D, EF-S 18-55mm f/3.5-5.6 USM lens 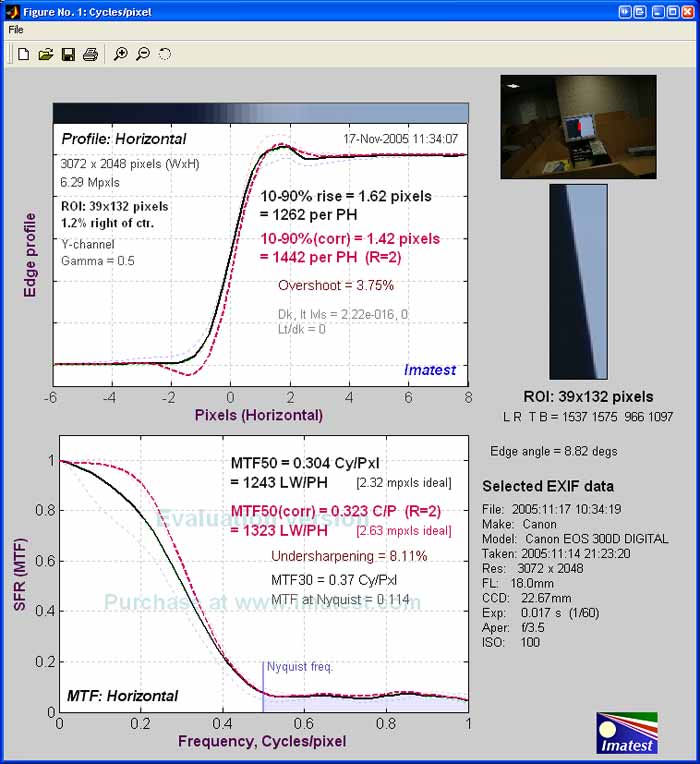 Photographs, processed by PhotoAcute Studio (8-bit JPEG images) 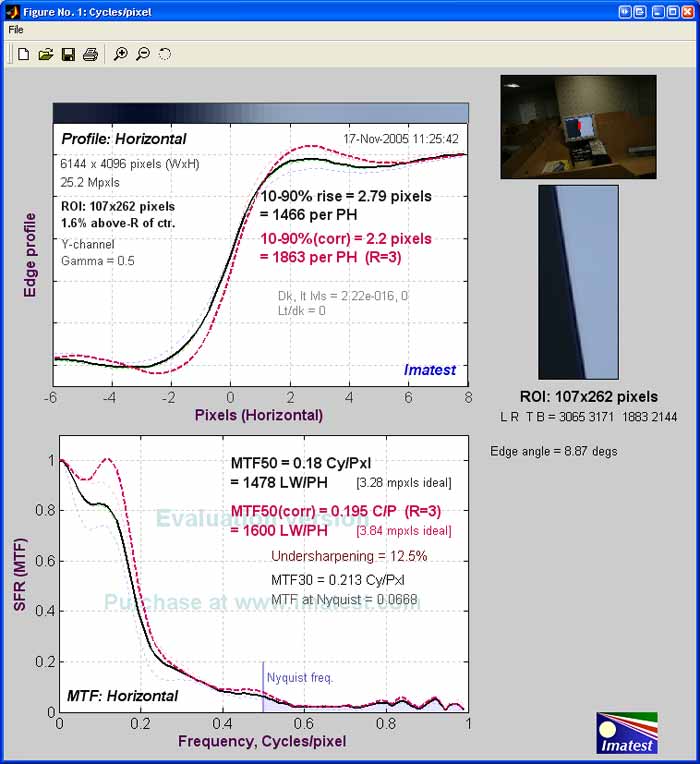 Photographs, processed by PhotoAcute Studio (16-bit RAW images) 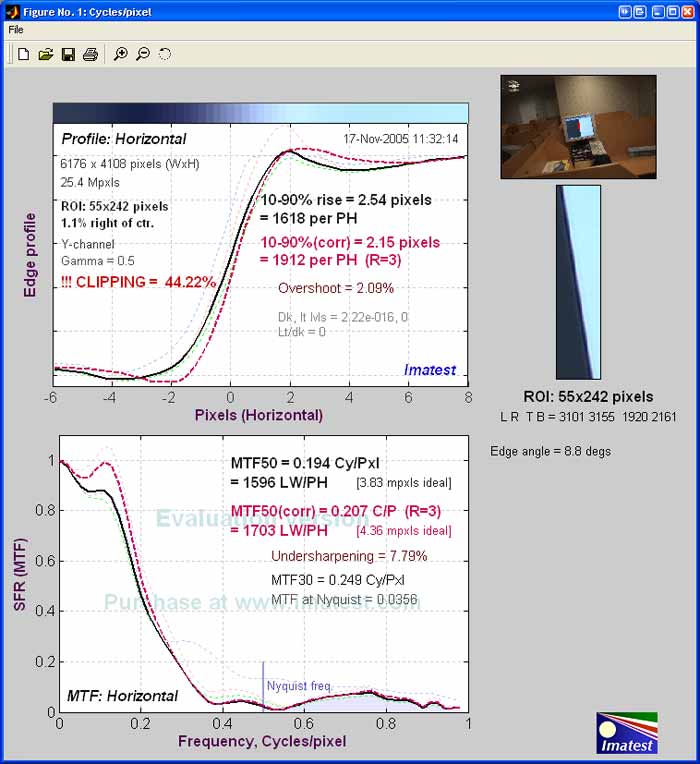 Measurement: Canon EOS 300D, EF50mm f/1.8 II lens 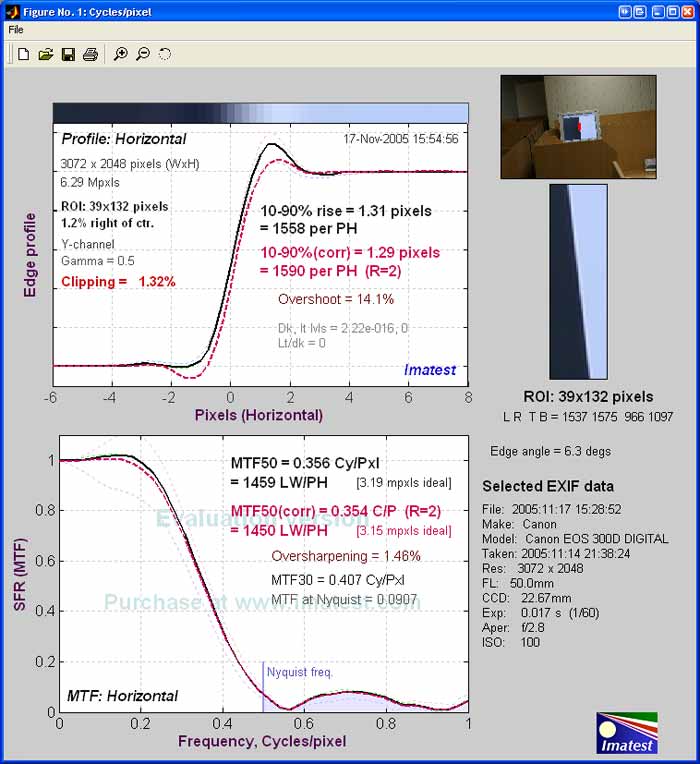 Photographs, processed by PhotoAcute Studio (8-bit JPEG images) 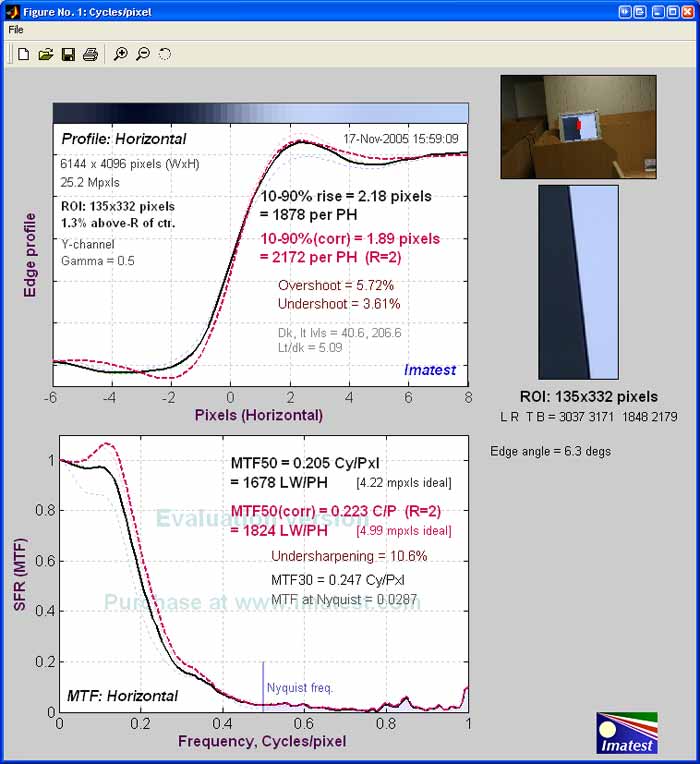 Photographs, processed by PhotoAcute Studio (16-bit RAW images) 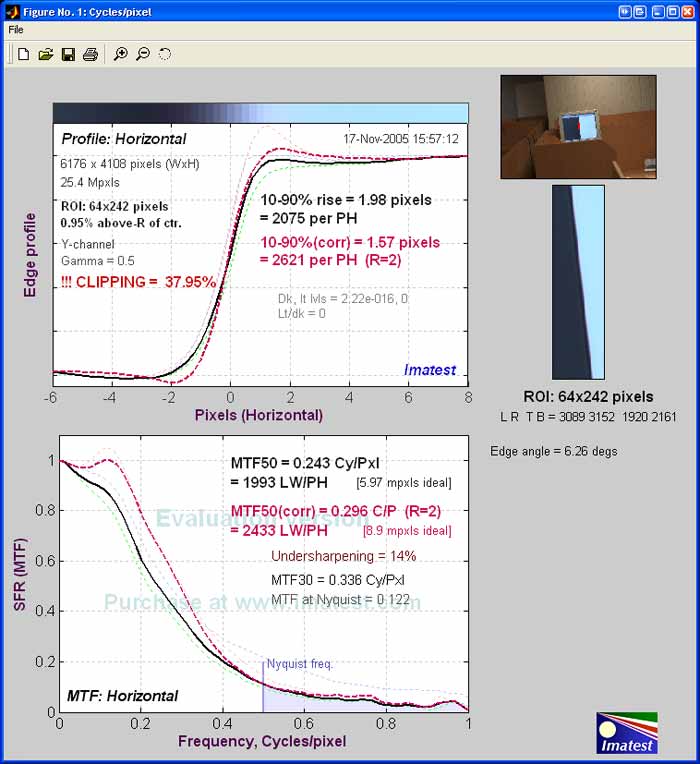 ResultsThis table shows MTF50 measurement results for Canon 300D with EF-S 18-55mm f/3.5-5.6 USM (kit) lens.In parenthesis: data for images corrected with standardized sharpening (see the detailed description above).
This table shows MTF50 measurement results for Canon 300D with EF50mm f/1.8 II lens. In parenthesis: data for images corrected with standardized sharpening (see the detailed description above).
We thank Imatest for providing the evaluation version of their excellent performance testing software.
|